
- Chart on the Go
Download PDF
Our latest chart explains how different short-term and long-term interest rate changes could impact fixed-income investments.
-
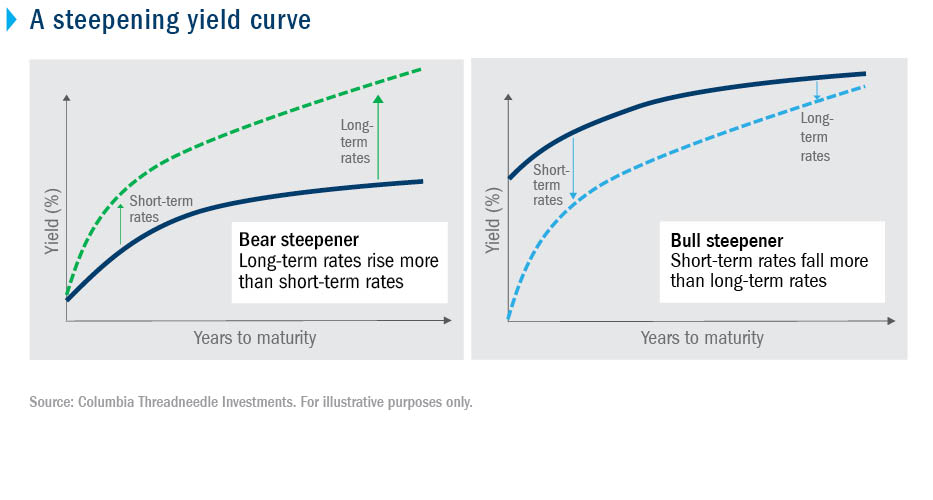
The yield curve shows the relationship between bond yields and maturity. A steepening yield curve is one where the difference between short-term and long-term rates increases. Whether the movement is at the short end or long end of the curve can provide insight into the market’s expectations for the economy and interest rate changes. Recalling the inverse relationship between price and yield, it could occur in two ways:
-
Long-term rates rise by more than short-term rates. This is referred to as a bear steepener. This movement suggests investors are concerned about inflation and expect the Fed to hike interest rates in the future, which makes long-term bonds less attractive. When this happens, fixed-income investors usually reduce their demand for long-term bonds, causing prices to fall and yields to increase.
-
Short-term rates fall by more than long-term rates. This is referred to as a bull steepener. This movement occurs as a result of an expectation or the actual cutting of the fed funds rate (a short-term rate) by the Federal Reserve to spur economic activity. Lower yields mean higher prices, which result in gains for bond investors.
-
The yield curve is constantly changing, and it’s important for investors to be aware of how it could impact their portfolios and to remain proactive in order to respond to potential opportunities.